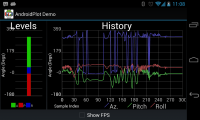
The creators of the function has a great tutorial on there website (allot of code is straight from there tutorial), but as always they assumed i had more knowledge than i do to get it working straight away... Since it wasn't enough to follow there steps, and i had to spend allot of time searching the internet for answers i figured i would post a step by step tutorial on how i managed to get it up and running.
1. Download the latest version of the "Core Library" .jar-file from there download page. (the only file you need to download)
2. Save the file into your "libs" folder, and it will automatically import the library under "Android Private Libraries" (if not, left click your project foldet/Properties/Java Build Path/ tab "Libraries" / "Add JARs"...)
3.Create folder res/"xml" which android recognizes as default xml-resources folder.
4. Create two xml-files, first one named "line_point_formatter_1.xml", and secound one whit "2" instead of "1"....
5. paste following code in the first xml-file: (you can put a linebreak in between every setting to get a better overview, but my code-viewer wouldn't let me...)
<?xml version="1.0" encoding="utf-8"?>
And this in the secound file:
<?xml version="1.0" encoding="utf-8"?>
6. Create a new xml file that you name "dimens.xml" and put in the res/values folder. Paste this in the file:
<?xml version="1.0" encoding="utf-8"?>16dp 16dp 10dp 20dp 13dp 13dp 15dp 15dp 20dp
7. Create a layout file in res/layout and name it something like "plotlayout.xml". Paste this code in the file:
8. Create a new .java-file in the src/"com.example.NAMEOFYOURPROJECT" (where most of the java-files are stored) and name the file "Plots.java"
9. Paste this in the file:
package com.androidplot.THENAMEOFYOURAPPLICATION;   //all in small case letters.

import android.app.Activity;
import android.os.Bundle;
import com.androidplot.xy.*;
import java.util.Arrays;

/**
 * A straightforward example of using AndroidPlot to plot some data.
 */
public class Plots extends Activity
{

    private XYPlot plot;

    @Override
    public void onCreate(Bundle savedInstanceState)
    {
        super.onCreate(savedInstanceState);

        setContentView(R.layout.plotlayout); //The name of your plotlayout.xml-file!

        // initialize our XYPlot reference:
        plot = (XYPlot) findViewById(R.id.mySimpleXYPlot);

        // Create a couple arrays of y-values to plot:
        Number[] series1Numbers = {1, 8, 5, 2, 7, 4};
        Number[] series2Numbers = {4, 6, 3, 8, 2, 10};

        // Turn the above arrays into XYSeries':
        XYSeries series1 = new SimpleXYSeries(
                Arrays.asList(series1Numbers),          // SimpleXYSeries takes a List so turn our array into a List
                SimpleXYSeries.ArrayFormat.Y_VALS_ONLY, // Y_VALS_ONLY means use the element index as the x value
                "Series1");                             // Set the display title of the series

        // same as above for series 2
        XYSeries series2 = new SimpleXYSeries(Arrays.asList(series2Numbers), SimpleXYSeries.ArrayFormat.Y_VALS_ONLY, "Series2");

        // Create a formatter to use for drawing a series using LineAndPointRenderer
        // and configure it from res/xml/config-files:
        LineAndPointFormatter series1Format = new LineAndPointFormatter();
        series1Format.setPointLabelFormatter(new PointLabelFormatter());
        series1Format.configure(getApplicationContext(),
                R.xml.line_point_formatter_1.xml);   //Name of the 1'st xml-config file

        // add a new series' to the xyplot:
        plot.addSeries(series1, series1Format);

        // same as above:
        LineAndPointFormatter series2Format = new LineAndPointFormatter();
        series2Format.setPointLabelFormatter(new PointLabelFormatter());
        series2Format.configure(getApplicationContext(),
                R.xml.line_point_formatter_2.xml);   //Name of the 2'nd xml-config file
        plot.addSeries(series2, series2Format);

        // reduce the number of range labels
        plot.setTicksPerRangeLabel(3);
        plot.getGraphWidget().setDomainLabelOrientation(-45);

    }
}
10. Add these lines to the "Manifest file" (found in the root, and named "YOURAPPNAMEManifest.xml")
And put the lines in between these tags:
and
11. Now it's time to test the plot. create a button with an onClickListener whit this code in it:
Intent i = new Intent(getApplicationContext(), Plots.class);
startActivityForResult(i, 2);
which will start a new intent which call the Plots-class which in term opens the plotts-layout showing the graph of the numbers.
Now when you know how the file-system works, try next tutorial they have posted, which is a dynamically updated plot over the phones tilt... =)
No comments:
Post a Comment